- Home
- Departments
- Customer Service
- Water Rates
Water Rates
HOW ARE WATER RATES DEVELOPED
The water rates are developed using cost of service principles set forth by the American Water Works Association M1 Manual titled Principles of Water Rates, Fees and Charges (AWWA M1 Manual). Cost of service principles endeavor to distribute costs to customer classes in accordance with the way each class uses the water system. The City hires a consultant to prepare a comprehensive study to separates costs into four components: “(1) base costs, (2) extra capacity costs, (3) customer costs, and (4) direct fire protection costs.” Base costs are costs that are associated with meeting average daily demand needs and include operations and maintenance costs and capital costs designed to meet average load conditions. Extra capacity costs are costs associated with meeting peak demand. Customer costs are costs associated with serving customers, such as meter reading, billing, customer service, etc. Direct fire protection costs are related solely to the fire protection function of a water system, such as fire hydrants and related branch mains and valves.
The City’s water service fees are comprised of two components: (1) a monthly service charge, and (2) a consumption charge. The monthly service charge is a fixed charge based on the size of the meter serving a property, and is calculated to recover a portion of the City’s fixed costs, such as the costs of billing and collections, customer service, meter reading, meter maintenance all of which do not vary with water use. The monthly service charge also collects a portion of capacity related costs. The consumption rate recovers all remaining costs associated with meeting base and extra capacity costs.
WATER SOURCES AND SYSTEM FACILITIES
The City provides water service to approximately 3,800 accounts and has roughly 60 miles of pipeline, and 9 treated water storage tanks. The City's water treatment plant is capable of distributing roughly 9.72 million gallons of treated water per day (MGD).
Depending on whether the City is in a constrained or non-constrained year, water is procured from several potential sources: (1) the Central Valley Project (CVP); (2) The McConnell Foundation; and (3) Anderson Cottonwood Irrigation District.
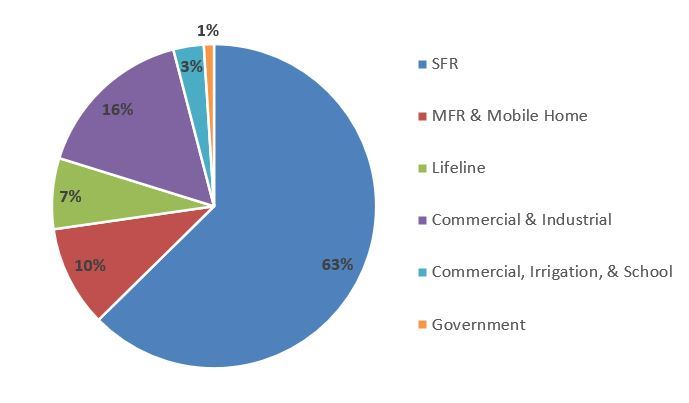
WATER USE
The below chart shows the FY 2016 water use by customer class. This pie chart shows the percentage of total projected water use by customer class for FY 2016. Total projected water sales were 61,090,084 cubic feet (CF) or 1,402 acre feet (AF)
 WATER RATE INFORMATION
Current Water Rates (2024-2029)